Panels
8 panels provide valuable KPI data - at-a-glance - viewable on any modern, internet-connected device.
Gross Profit
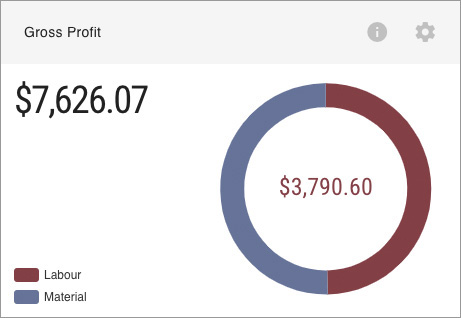
The total sales of the shop minus the total cost of the Material and Labour sold during the period. Gross Profit assesses a shop's efficiency at using its labour and materials in producing services.
The result is broken down into Labour and Material components.
The Math:
Net - (Labour Cost + Material Cost)
Invoiced vs Estimate
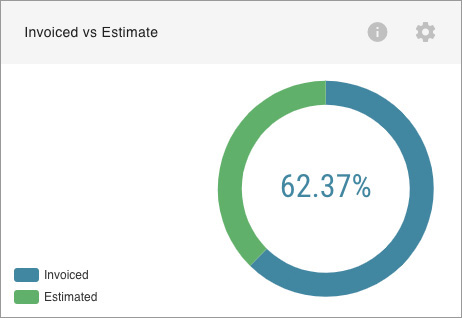
The amount actually sold compared to potential sales during the period. Invoiced vs Estimate identifies a shop's proficiency at converting estimates into sales.
The result is the percentage of total potential sales.
The Math:
Net / (Net + Deferred Labour + Deferred Material)
Sales Mix
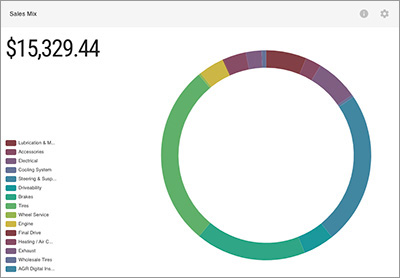
Total sales, with the relative proportion of the shop's sales per service department during the period. Sales Mix illustrates the shop's services diversity relative to total sales.
The sum is total sales, the chart breaks that figure into percentages per service department.
The Math:
Sum of every Service Category Total during period
Invoice Count

The total number of invoiced repair orders during the period.
The Math:
[unit] Count of Invoices during period
Effective Door Rate

The amount your shop is making per billable hour during the period. Effective Door Rate identifies the overall profitability of the shop.
The value is the average hourly rate in dollars.
The Math:
Total: Labour total / Labour billed, during the period
Average Work Order
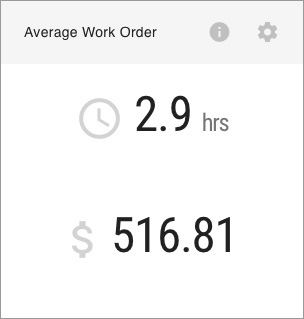
Average hours spent, and sales, per work order.
The Math:
Total: Labour total / Labour billed, during the period
Tech Performance
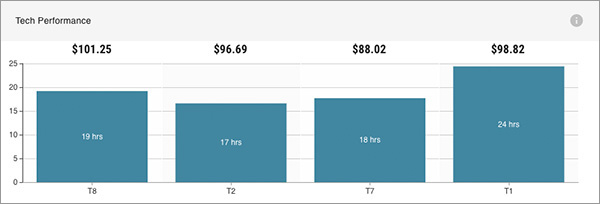
The total hours and effective door rate of each tech during the period. Tech Performance identifies technical resource allocation, providing insight into the the shop's resource management efficiency.
There are no configurable targets at this time.
The Math:
Total: Labour total / Labour billed, during the period
Sales Mix by Service Advisor
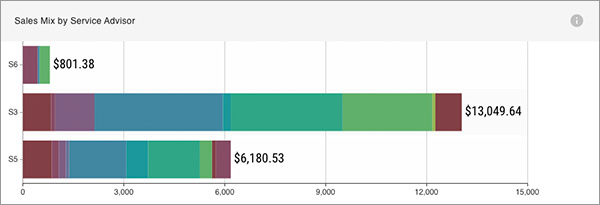
Total sales per Service Advisor (SA), with the relative proportion of the shop's sales per service department during the period. Sales Mix by Service Advisor illustrates each SA's services diversity relative to total sales.
Each bar represents an SA. The sum of each bar is the portion of total sales attributable to that SA. The bar breaks each SA figure into percentages per service department.
There are no configurable targets at this time.
The Math:
Category breakdown of billed hours per Service Advisor during the period